Run swirl Exercises #1
0 points possible (ungraded)
What version of R are you using (hint: make sure you download the latest version and then type version)? Please note that this question does not count toward your grade, but it is important to make sure that you are using the latest version of R.> version
R will return
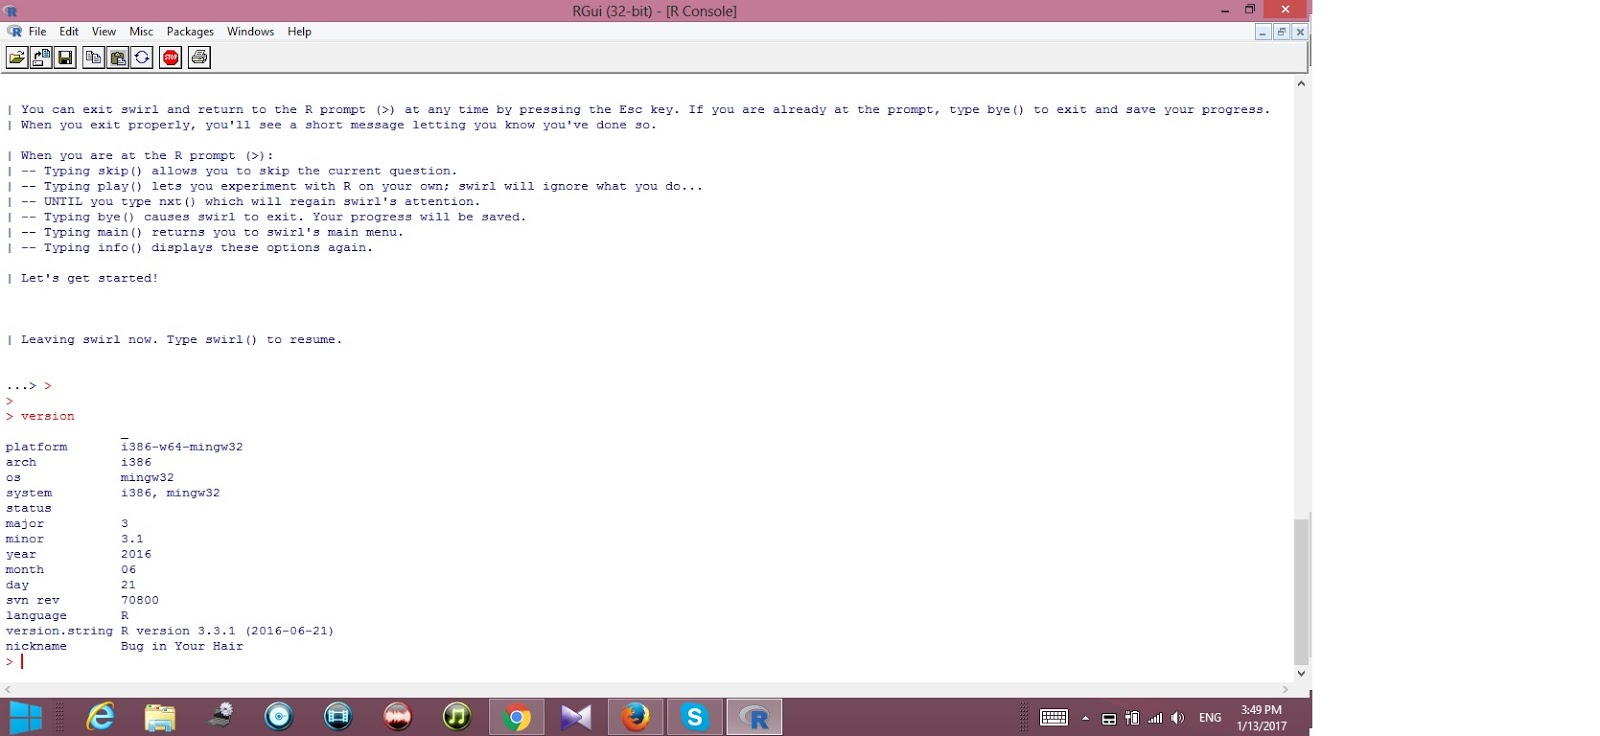
Answer: 3.3.0
Run swirl Exercises #2
1/1 point (graded)
Create a numeric vector containing the numbers 2.23, 3.45, 1.87, 2.11, 7.33, 18.34, 19.23. What is the average of these numbers?
z <- c(2.23, 3.45, 1.87, 2.11, 7.33, 18.34, 19.23)
y <-mean(z)
y
Answer: 7.942
Run swirl Exercises #3
1 point possible (graded)
Use a for loop to determine the value of 
for (i in 1:25) {
sum <- sum + i^2
sum
}
Answer: 5525
Run swirl Exercises #4
1 point possible (graded)
The cars dataset is available in base R. You can type cars to see it. Use the class function to determine what type of object is cars.class(cars)
Answer: data.frame
Run swirl Exercises #5
1/1 point (graded)
How many rows does the cars object have?nrow(cars)
Answer: 50
Run swirl Exercises #6
1 point possible (graded)
What is the name of the second column of cars?names(cars)[2]
Answer: dist
Run swirl Exercises #7
1/1 point (graded)
The simplest way to extract the columns of a matrix or data.frame is using [. For example you can access the second column with cars[,2]. What is the average distance traveled in this dataset?mean(cars[,2])
Answer: 42.98
Run swirl Exercises #8
1/1 point (graded)
Familiarize yourself with the which function. What row of cars has a a distance of 85?which(cars[,2]==85)
Answer: 50
To run the written code in file we'll call it an R markdown code file.
We can run multiple lines of command in another window as a R markdown.
Here we will test some of the basics of R data manipulation which you should know or should have learned by following the tutorials above. You will need to have the file
femaleMiceWeights.csv in your working directory. As we showed above, one way to do this is by using the downloader package:
library(downloader)
url <- "https://raw.githubusercontent.com/genomicsclass/dagdata/master/inst/extdata/femaleMiceWeights.csv"
filename <- "femaleMiceWeights.csv"
download(url, destfile=filename)
Here we will test some of the basics of R data manipulation which you should know or should have learned by following the tutorials above. You will need to have the filefemaleMiceWeights.csvin your working directory. As we showed above, one way to do this is by using thedownloaderpackage:
Getting Started Exercises #1
1 point possible (graded)
Read in the file femaleMiceWeights.csv and report the exact name of the column containing the weights.dat <- read.csv("femaleMiceWeights.csv")
dat <- read.csv("femaleMiceWeights.csv")
head(dat)
##   Diet Bodyweight
## 1 chow      21.51
## 2 chow      28.14
## 3 chow      24.04
## 4 chow      23.45
## 5 chow      23.68
## 6 chow      19.79
names(dat)[2]
Answer:Bodyweight
Getting Started Exercises #2
1/1 point (graded)
The
[ and ] symbols can be used to extract specific rows and specific columns of the table. What is the entry in the 12th row and second column?dat[12,2]
Answer: 26.25
Getting Started Exercises #3
1 point possible (graded)
You should have learned how to use the $ character to extract a column from a table and return it as a vector. Use $ to extract the weight column and report the weight of the mouse in the 11th row.weights <- dat$Bodyweight weights[11]
Answer: 26.91
Getting Started Exercises #4
1 point possible (graded)
The length function returns the number of elements in a vector. How many mice are included in our dataset?
weights <- dat$Bodyweight
length(weights)
Getting Started Exercises #5
1 point possible (graded)
To create a vector with the numbers 3 to 7, we can use seq(3,7) or, because they are consecutive, 3:7. View the data and determine what rows are associated with the high fat or hf diet. Then use the mean function to compute the average weight of these mice.View(dat) weights <- dat$Bodyweight mean( weights[ 13:24 ])
Answer: 26.83417
Getting Started Exercises #6
1/1 point (graded)
One of the functions we will be using often is
sample. Read the help file for sample using ?sample. Now take a random sample of size 1 from the numbers 13 to 24 and report back the weight of the mouse represented by that row. Make sure to type set.seed(1) to ensure that everybody gets the same answer.set.seed(1) i <- sample( 13:24, 1) dat$Bodyweight[i]
Answer: 25.34
dplyr Exercises
For these exercises, we will use a new dataset related to mammalian sleep. This link describes the data. Download the CSV file from this location:
Rmd file here
library(downloader)
url="https://raw.githubusercontent.com/genomicsclass/dagdata/master/inst/extdata/msleep_ggplot2.csv"
filename <- basename(url)
download(url,filename)
We are going to read in this data, then test your knowledge of they key
dplyr functions select and filter. We are also going to review two different _classes_: data frames and vectors.
Rmd file here
dplyr Exercises #1
1/1 point (graded)
Read in the msleep_ggplot2.csv file with the function read.csv and use the function class to determine what type of object is returned.dat <- read.csv("msleep_ggplot2.csv")
class(dat)
Answer: data.frame
dplyr Exercises #2
1 point possible (graded)
Now use the filter function to select only the primates. How many animals in the table are primates? Hint: the nrow function gives you the number of rows of a data frame or matrix.library(dplyr) head(dat) ## name genus vore order conservation ## 1 Cheetah Acinonyx carni Carnivora lc ## 2 Owl monkey Aotus omni Primates <NA> ## 3 Mountain beaver Aplodontia herbi Rodentia nt ## 4 Greater short-tailed shrew Blarina omni Soricomorpha lc ## 5 Cow Bos herbi Artiodactyla domesticated ## 6 Three-toed sloth Bradypus herbi Pilosa <NA> ## sleep_total sleep_rem sleep_cycle awake brainwt bodywt ## 1 12.1 NA NA 11.9 NA 50.000 ## 2 17.0 1.8 NA 7.0 0.01550 0.480 ## 3 14.4 2.4 NA 9.6 NA 1.350 ## 4 14.9 2.3 0.1333333 9.1 0.00029 0.019 ## 5 4.0 0.7 0.6666667 20.0 0.42300 600.000 ## 6 14.4 2.2 0.7666667 9.6 NA 3.850 dat2 <- filter(dat, order=="Primates") nrow(dat2)
Answer: 12
dplyr Exercises #3
1/1 point (graded)
What is the class of the object you obtain after subsetting the table to only include primates?dat2 <- filter(dat, order=="Primates") class(dat2)
Answer: data.frame
dplyr Exercises #4
1 point possible (graded)
Now use the select function to extract the sleep (total) for the primates. What class is this object? Hint: use %>% to pipe the results of the filter function to select.y <- filter(dat, order=="Primates") %>% select(sleep_total) class(y)
Answer: data.frame
dplyr Exercises #5
1/1 point (graded)
Now we want to calculate the average amount of sleep for primates
(the average of the numbers computed above). One challenge is that the mean function requires a vector so, if we simply apply it to the output above, we get an error. Look at the help file for unlist and use it to compute the desired average.y <- filter(dat, order=="Primates") %>% select(sleep_total) %>% unlist mean( y )
Answer: 10.5
dplyr Exercises #6
1 point possible (graded)
For the last exercise, we could also use the dplyr summarize function. We have not introduced this function, but you can read the help file and repeat exercise 5, this time using just filter and summarize to get the answer.
https://courses.edx.org/courses/course-v1:HarvardX+PH525.1x+1T2018/courseware/35f78842650e411ba9a610bdb4022c07/e9ed5adb799d4126b02f6332d6d7db55/?child=first
ตอบลบ